Display SIP message flow using Sipviewer
- Former user (Deleted)
- Former user (Deleted)
- Former user (Deleted)
Diagnosing complex SIP problems often requires looking at the SIP message flow between the components of sipXecs, as well as to and from phones and external gateways. This page tells the adventurous how to use the tools that come with sipXecs to display SIP message flows. Sipviewer is a very powerful tool used to diagnose problems.
Notice
Sipviewer is not supported in version 4.6 and above. In version 4.6, this functionality is replaced with Homer.
To enable Homer go to System/Servers/Core Services. Enable SIP Capture DB, SIP Capture Search Tool, and SIP Capture Server. Once enabled, SIP Capture will appear under the Diagnostics Tab. CLick on SIP Capture Web Interface to open Homer. Use your superadmin username and password for entering Homer.
Installation
Before you can display the messages, you need to install the viewer. You can do that either on the sipXecs system itself (which requires a few prerequisites not installed by the ISO image), or standalone on your regular system (Windows, Mac, or Linux). Once you've gotten one of these done, you're ready to collect trace data for viewing.
Standalone
There is a standalone installer for the sipviewer tool in the temp area on the sipxecs project server:
xecsuserV4r2:Download the sipviewer installer
The above installer is a java .jar file - execute it on your system to run the installer, eg:
java -jar sipviewer-install.jar
The installer should work on any system (Linux, Windows, Mac) that has java installed.
On your sipXecs system
On RPM-based distributions sipviewer is installed with the sipxtools RPM. Sipviewer is written in Java and requires an X server to be running to display results graphically.
Getting SIP Messages to display
The SIP messages are logged by sipXecs components at the INFO logging level; this is a more verbose level than the default NOTICE level. The log level can be changed in the Web UI by going to "System/General/Logging". You must restart the components for the change in logging level to take effect.
To get useful trace information, at least the proxy and registrar must be set at INFO or DEBUG (INFO is sufficient for traces, and makes for much smaller log files). You should also have detailed logging for any other component you suspect to be involved in the problem.
If you can get the time a problem call is made, a good way to find it is to look in the proxy log file by searching the list of dialogs with the sipx-dialog-count command:
sipx-dialog-count /var/log/sipxpbx/sipXproxy.log
it will print a list like this:
Messages Method Time Call-Id
-------------- ---------- ------------------- ------------------------------------------------
50 INVITE 2009-12-11T22:22:20 nekyxpqiedpefov@example.org
36 INVITE 2009-12-11T22:17:19 zbwmxexjtxvlwer@example.org
search that list for the call that starts at the right time (log times are in UTC), and then use the call-id from that call as the <token> argument to sipx-trace - you'll get just the one call you're after.
Then use 'sipx-trace' to create an xml file that contains trace data for messages on your system:
sipx-trace --all-components --output <filename> <token>...
where <filename> is the output file and <token> is some token that will be in the call (call-id values are best for this, but even the calling number followed by '@' will find it; it will just find lots of other stuff too).
You can copy that xml file to any system where you have installed the sipviewer tool to display the trace, and you can post that file to a mailing list to ask for help interpreting it (be sure to also post a description of your configuration, including the IP addresses for all the components that show in the trace).
Using Sipviewer over an ssh connection
If you have an account on the sipXecs system that you can log into using ssh, and your workstation is a Linux (or compatible) system you can set up remote use of sipx-trace from another system:
- Install your ssh public key in your account on the sipXecs system. You should then be able to execute a command remotely on that system without entering a password:
> ssh sipxecs.example.com echo ok
ok
- Configure that account so that it can read the sipXecs log files (making the account a member of the 'sipxchange' group should do this).
Now you can execute sipx-trace remotely by adding the --system (-s) argument:
sipx-trace --system sipxecs.example.com --all-components --output <filename> <token>...
If you have an HA sipXecs, you must query all the systems at the same time to get the trace data:
sipx-trace -s sipxecs-master.example.com -s sipxecs-dist1.example.com --all-components --output <filename> <token>...
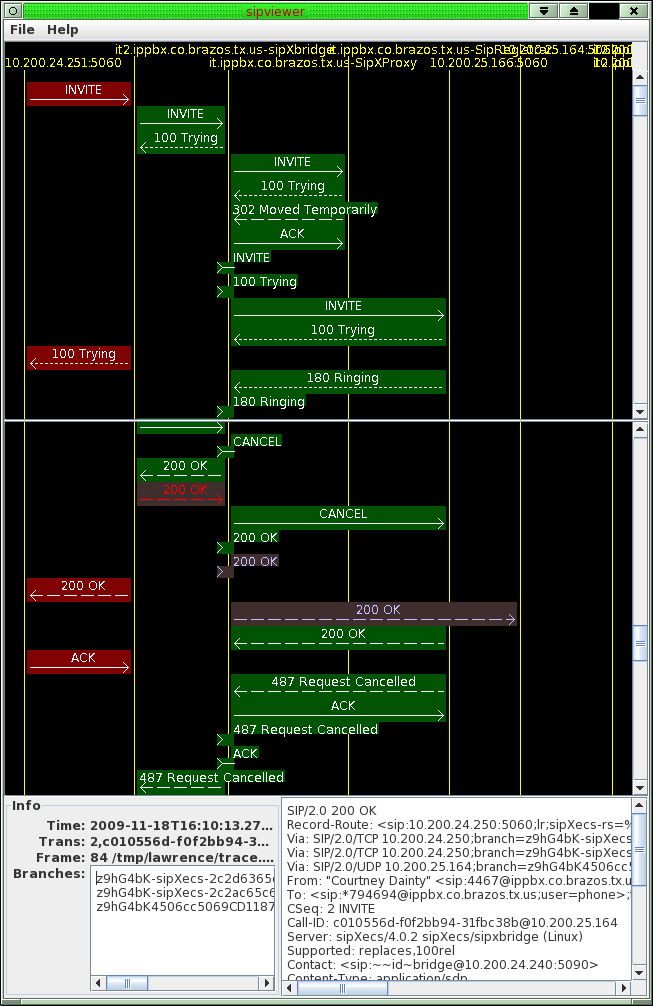
The sipviewer display
<center>
</center>
- The vertical lines denote the SIP agents sending and receiving messages. Beware that sometimes sipviewer cannot determine that two addresses are equivalent, and so an agent will be represented by more than one vertical line. You can drag the headers of two vertical lines to move them, so you can put the vertical lines in any order you want. If two vertical lines are really the same agent, you can drop one onto the other and it will appear correctly (be careful - if you combine things that are not the same it can create confusion).
- When the mouse is over a SIP message, it is highlighed in red, and the details of the message are shown in the lower panels. If you click on the message, a window pops up giving the full text of the message. The window can be closed with the Escape key.
- When a SIP message is highlighted, related messages are highlighted:
- green - other messages in this transaction, between these two agents
- blue - other messages in this transaction, between different agents in the chain
- yellow - other messages in this dialog
- SIP messages colored blue and yellow also are coded:
- light color - has the same from-tag and to-tag as the chosen message, and so is in the same branch of a fork
- dark color - has different tags, and so is either in a different branch of a fork, or (more likely) are the request and response of an initial request (since the request has no to-tag, but the response does)
- Right clicking on the display pops up a menu that lets you:
- Split the screen horizontally into two panes with separate scrolling. This is useful when you need to see the relationships between widely separated messages.
- Highlight the background of all messages in the same SIP dialog.
- Take a screenshot of the current display.
- Looking at a few normal calls will familiarize you with the standard sipX message flow, so you will be able to recognize erroneous message flows.
Information on the low level tools
Make sure the necessary packages are installed on the host that runs sipXecs:
yum install xorg-x11-xinit
yum install java-1.5.0-sun-fonts
The package java-1.5.0-sun-fonts can be found in the sipXecs repository.
In order to display all the SIP traffic through sipX, execute the following commands:
cd /var/log/sipxpbx
merge-logs
sipviewer merged.xml
Unless you cleared the logs and restarted very recently, that will often produce more data than you can display. Using the sipx-trace script to filter the results will usually be more useful.
- The executables (merge-logs and sipviewer, and the two programs that merge-logs invokes, syslog2siptrace and siptrace-merge) are normally installed in
/usr/bin. If you have them installed in a non-standard directory, you should have that directory in your path. You can invoke merge-logs and sipviewer with full path names, but merge-logs expects syslog2siptrace and siptrace-merge to be runnable through the path. - These programs are a collection of shell scripts, Perl scripts, and Java executables. If you con't have those interpreters available, this method won't work.
- Often there are many SIP messages in the logs that you aren't interested in. merge-logs takes a collection of arguments that will exclude messages that are not of interest. Its arguments are the same as those of siptrace-merge, which are described at the top of that file (
/usr/bin/siptrace-merge). Especially useful are:--containing: to specify the call-ID of a dialog--afterand--before: to restrict to a certain period of time--exclude-method: to screen out the housekeeping SUBSCRIBE, NOTIFY, PUBLISH, and REGISTER transactions.
The timestamps that --after and --before use are in GMT, use the format 2006-09-01T20:32:10, and are compared with the lines of the log files as text strings. Use date -u +%Y-%m-%dT%H:%M:%S to print the current time in this format).